


(Image by Freepik)
Let's have a look at the Python library Dash. You can use it to build elaborate web apps with dashboards, dropdowns, sliders, text input, date pickers, etc.
And you can build and deploy them completely in the cloud!
(Check out my other posts Web Apps with Python - Gradio and Web Apps with Python - Streamlit)
Intro
Dash is a product from the people who bring you the Plotly charting library. They say "Dash is ideal for building and deploying data apps with customized user interfaces. It's particularly suited for anyone who works with data."
The syntax may seem a bit daunting at first, but it gets easier once you understand how the app layout and callbacks work. Check out the tutorials section on the Dash website.
Availablity
Plotly has a Dash Enterprise product, but anybody can use the free open-source library. In a cloud notebook such as Google Colab, use the magic command '!pip install jupyter-dash' in the first cell.
(in notebook environments like Google Colab, you need to use the library 'jupyter-dash' instead of 'dash' -- see the Colab notebook linked below)
Example Code
The Plotly community have created a helpful collection of examples with code at this site: Dash Example Index.
Limitations
Dash seems to favour only Plotly or Plotly Express for charts and visualisation. I like Plotly Express, so I don't mind this limitation, but if you prefer some other charting library, you may face challenges using it in a Dash app.
Build in the Cloud
It is very easy to create and test Dash web apps in the cloud! I have recreated this simple Dash bar chart with dropdown example in two places -- Google Colab and Replit:
GOOGLE COLAB
Here is the link to my Google Colab notebook.
Note that you have the option of viewing the visualisations in two ways.
View the visualisation as an output of a notebook cell
if __name__ == "__main__": app.run_server(mode='inline')View the visualisation in a browser window (I'm using Chrome) via localhost
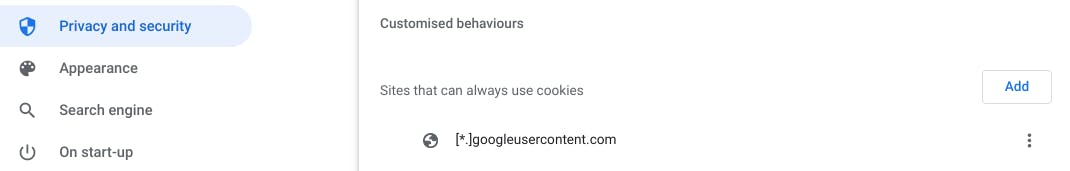
if __name__ == "__main__": app.run_server(mode='external')To view the app in a browser window, you have to enable cookies from 'googleusercontent' in the Chrome browser settings, or the localhost link may not work.
REPLIT
Here is the link to my Replit project (see the 'Deployment' section below for more details).
For those who don't know what Replit is, it is an online IDE for Python and many other programming languages. Here is an introduction to get you started.
Create a new Python repl in Replit, paste the Python script in 'main.py' and run. Replit takes care of the rest. There is no need to install Dash.
Note that you have to specify the following in the Python script so that you can view the app through localhost.
if __name__ == "__main__":
    app.run(host='0.0.0.0', port=8080)
How do you view the results in Replit? That ties in with deployment, which we'll look at below.
Deployment
The deployment page of Plotly Dash says that Dash apps can be deployed to the web for free using Heroku, but we know that Heroku will stop offering its free tier in November 2022.
The good news is that you can use Replit to not just code and test, but also demo your apps!
Their blog explains how to do this if you have an existing app with the source code in a GitHub repository.
The first step is to import the code from the repo into a Replit project. Note that the free Replit plan allows you to pull only from public GitHub repos. There are also limitations on storage (500 MB) for the free plan.
Since I already had my code on Replit, I could skip this step.
Once you have your Replit project set up and have run the code, click on the arrow next to your project name on the top left, and select 'publish'. This gives you the options for the app name, description, etc, as well as the option to pay for certain features.
When you publish your project, you get a URL for it as follows: replit.com/@SMcoder/Dash-Bar-Chart-Dropdown..
If somebody else opens this URL, they will see a big triangular 'play' or 'run' button. Running this produces an in-frame view of the resulting app, as well as a link to view it in a separate browser window. The link for the separate window looks like this: dash-bar-chart-dropdown.smcoder.repl.co
Feel free to check it out, but I have to warn you that it may take a good while to load. You may need to try more than once. The free plan does not allow the 'always on' feature, and the available CPUs are limited in power. If you have a very complex app or dashboard to display, you may have to spring for a paid plan on Replit.
Conclusion
Dash is a great framework that you can use to build responsive and interactive data apps completely in the cloud.
The Dash website lists the components available in the open-source version, plus components made by the Plotly community. All this gives you a lot of flexibility to customise your apps.